Field Note · 3 September 2025
How I Integrated Amplitude with Lovable in 10 Mins
Supercharge your Lovable site analytics by integrating Amplitude in under 10 minutes. Track custom events, user behavior, and optimize your CTAs with ease.
- Filed
- 3 September 2025
- Author
- Dmitrii Abramov
- Reading time
- 2 min
- Share
Amplitude meets Lovable = ❤️
How I supercharged the analytics of my blog built with Lovable by integrating Amplitude
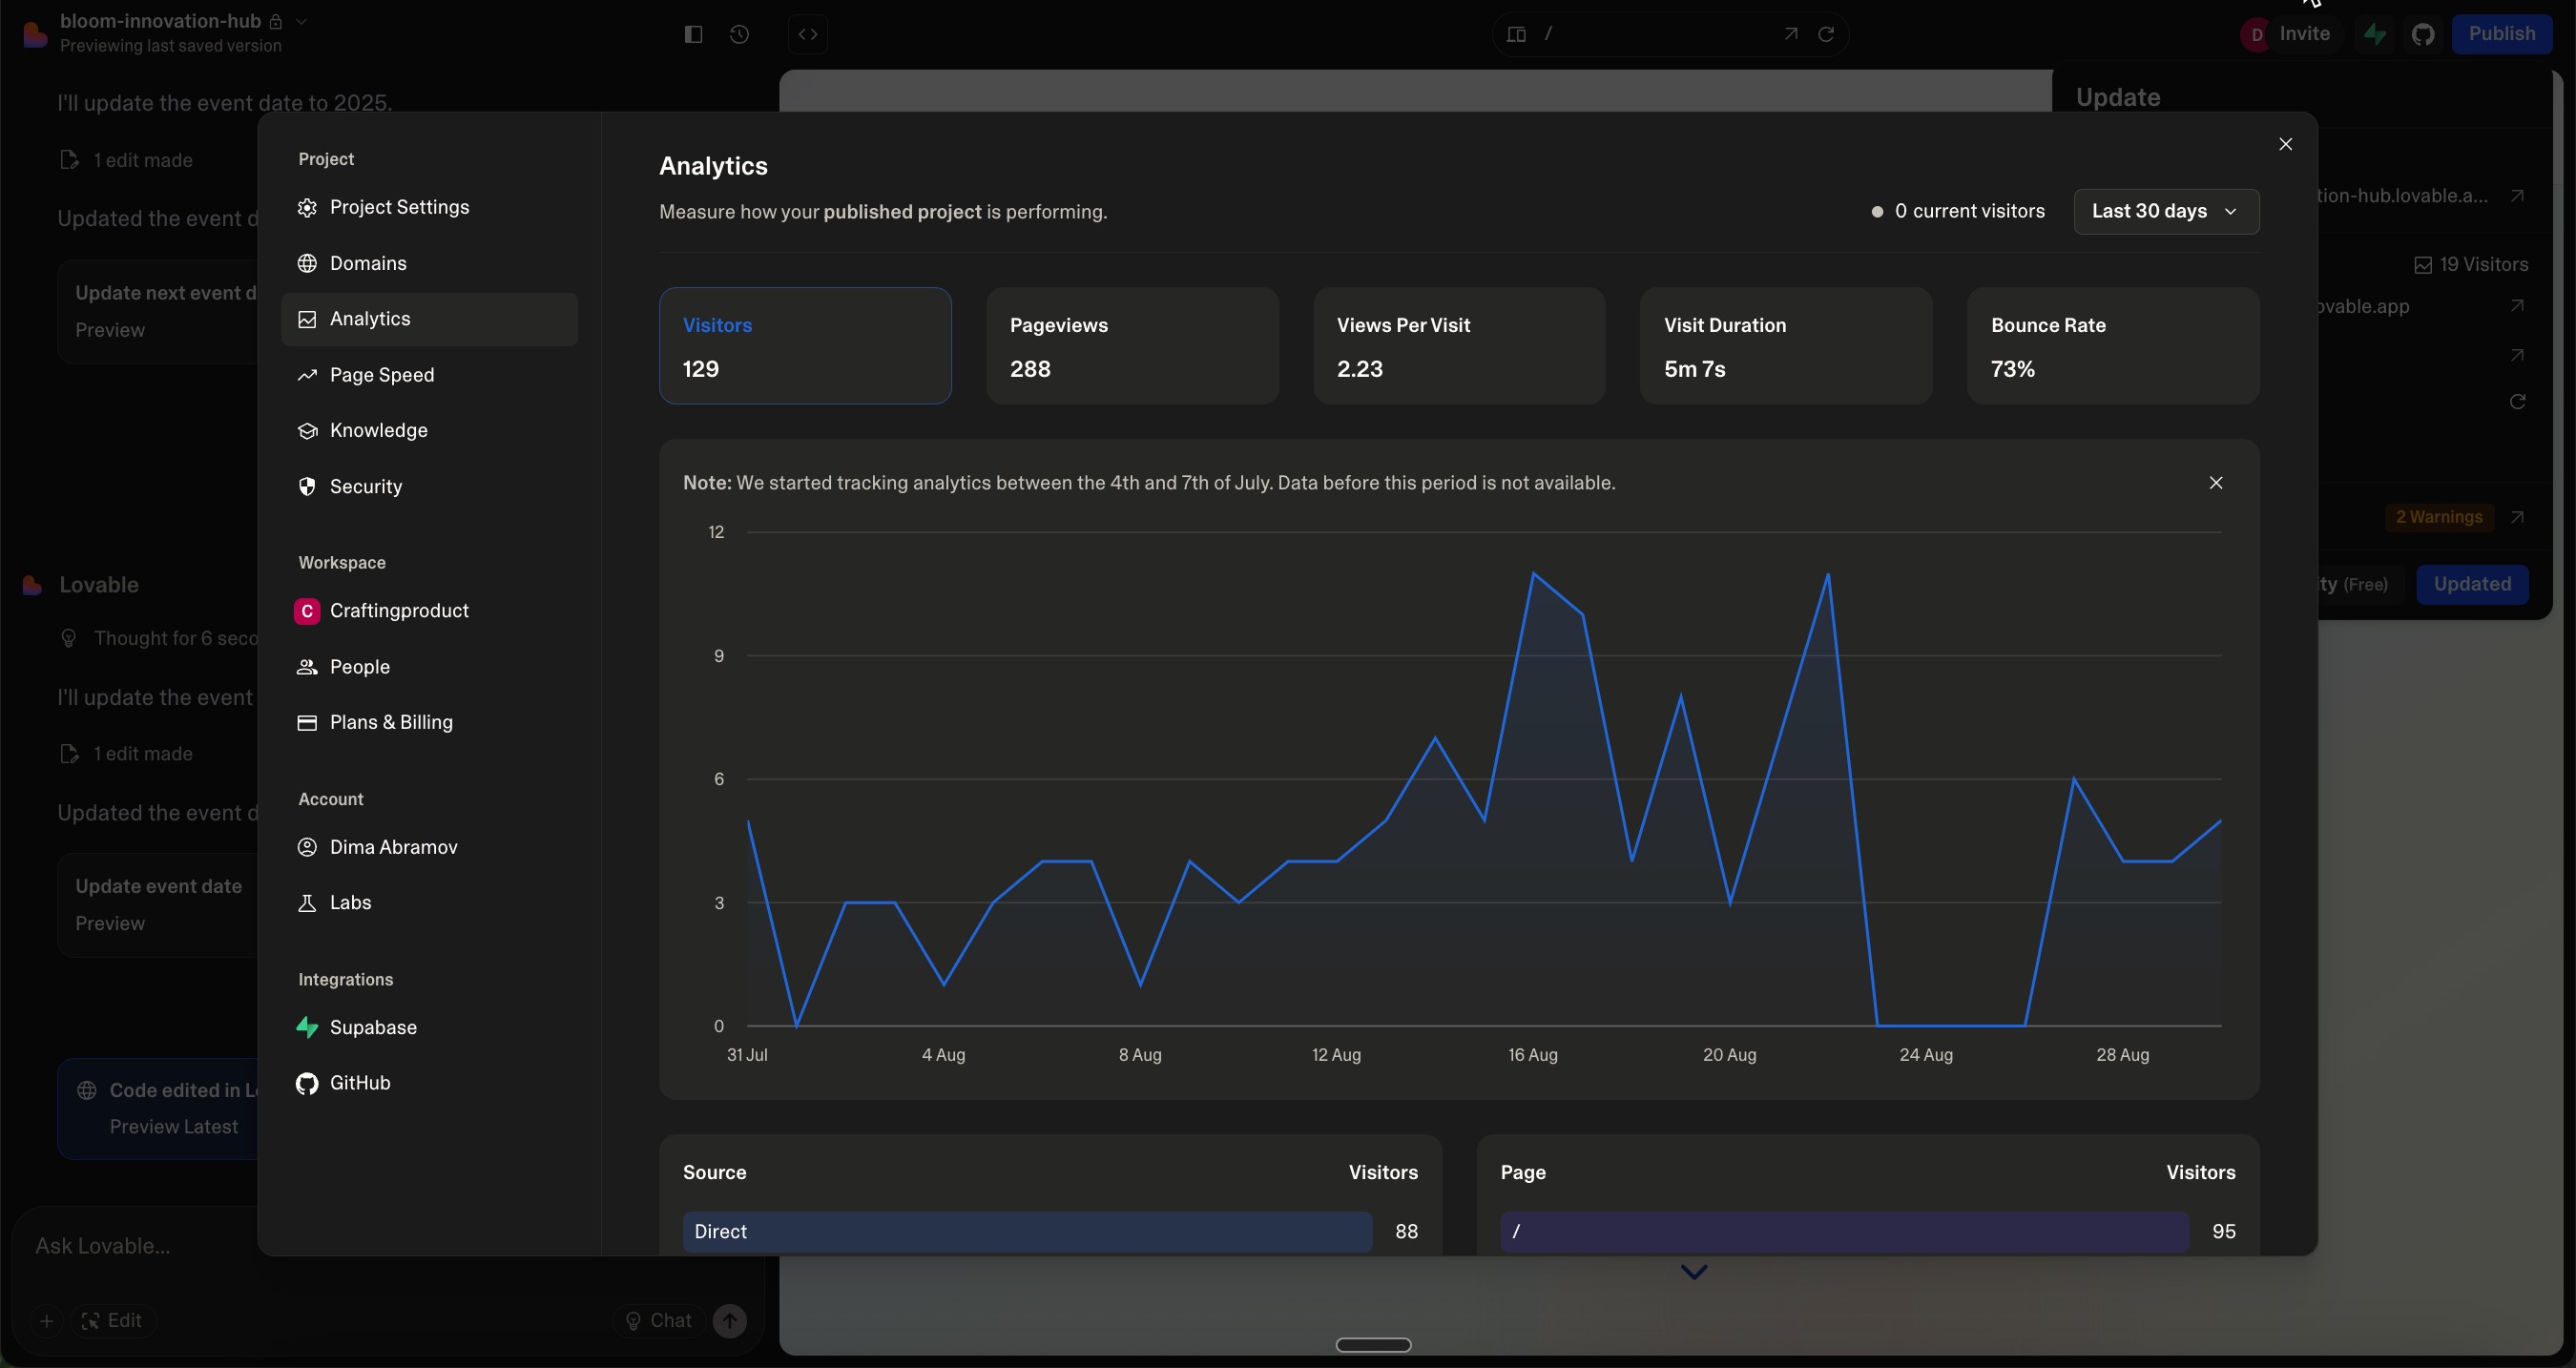
Recently, I launched my personal blog and community site using Lovable — a tool I love for how simple and fast it is to create clean, responsive websites. It comes with built-in analytics, which gives you a solid baseline: visitors, pageviews, session duration, traffic sources. Pretty decent for most use cases.
But as someone who thinks in product terms, I wanted more.
I needed answers to deeper questions: Are people actually engaging with my content? Are they clicking on the CTAs I added? Which sources bring the most engaged visitors? What pages drive the most meaningful interaction?
That’s where Amplitude came in.
Why Amplitude?
Amplitude is a powerful analytics platform used by product teams to understand user behavior. And the best part? It offers a free plan that’s perfect for small personal projects.
My Setup (Took Less Than 10 Minutes)
Here’s exactly what I did:
Created a free Amplitude account
Added the Amplitude tracking script in Lovable using a custom code block
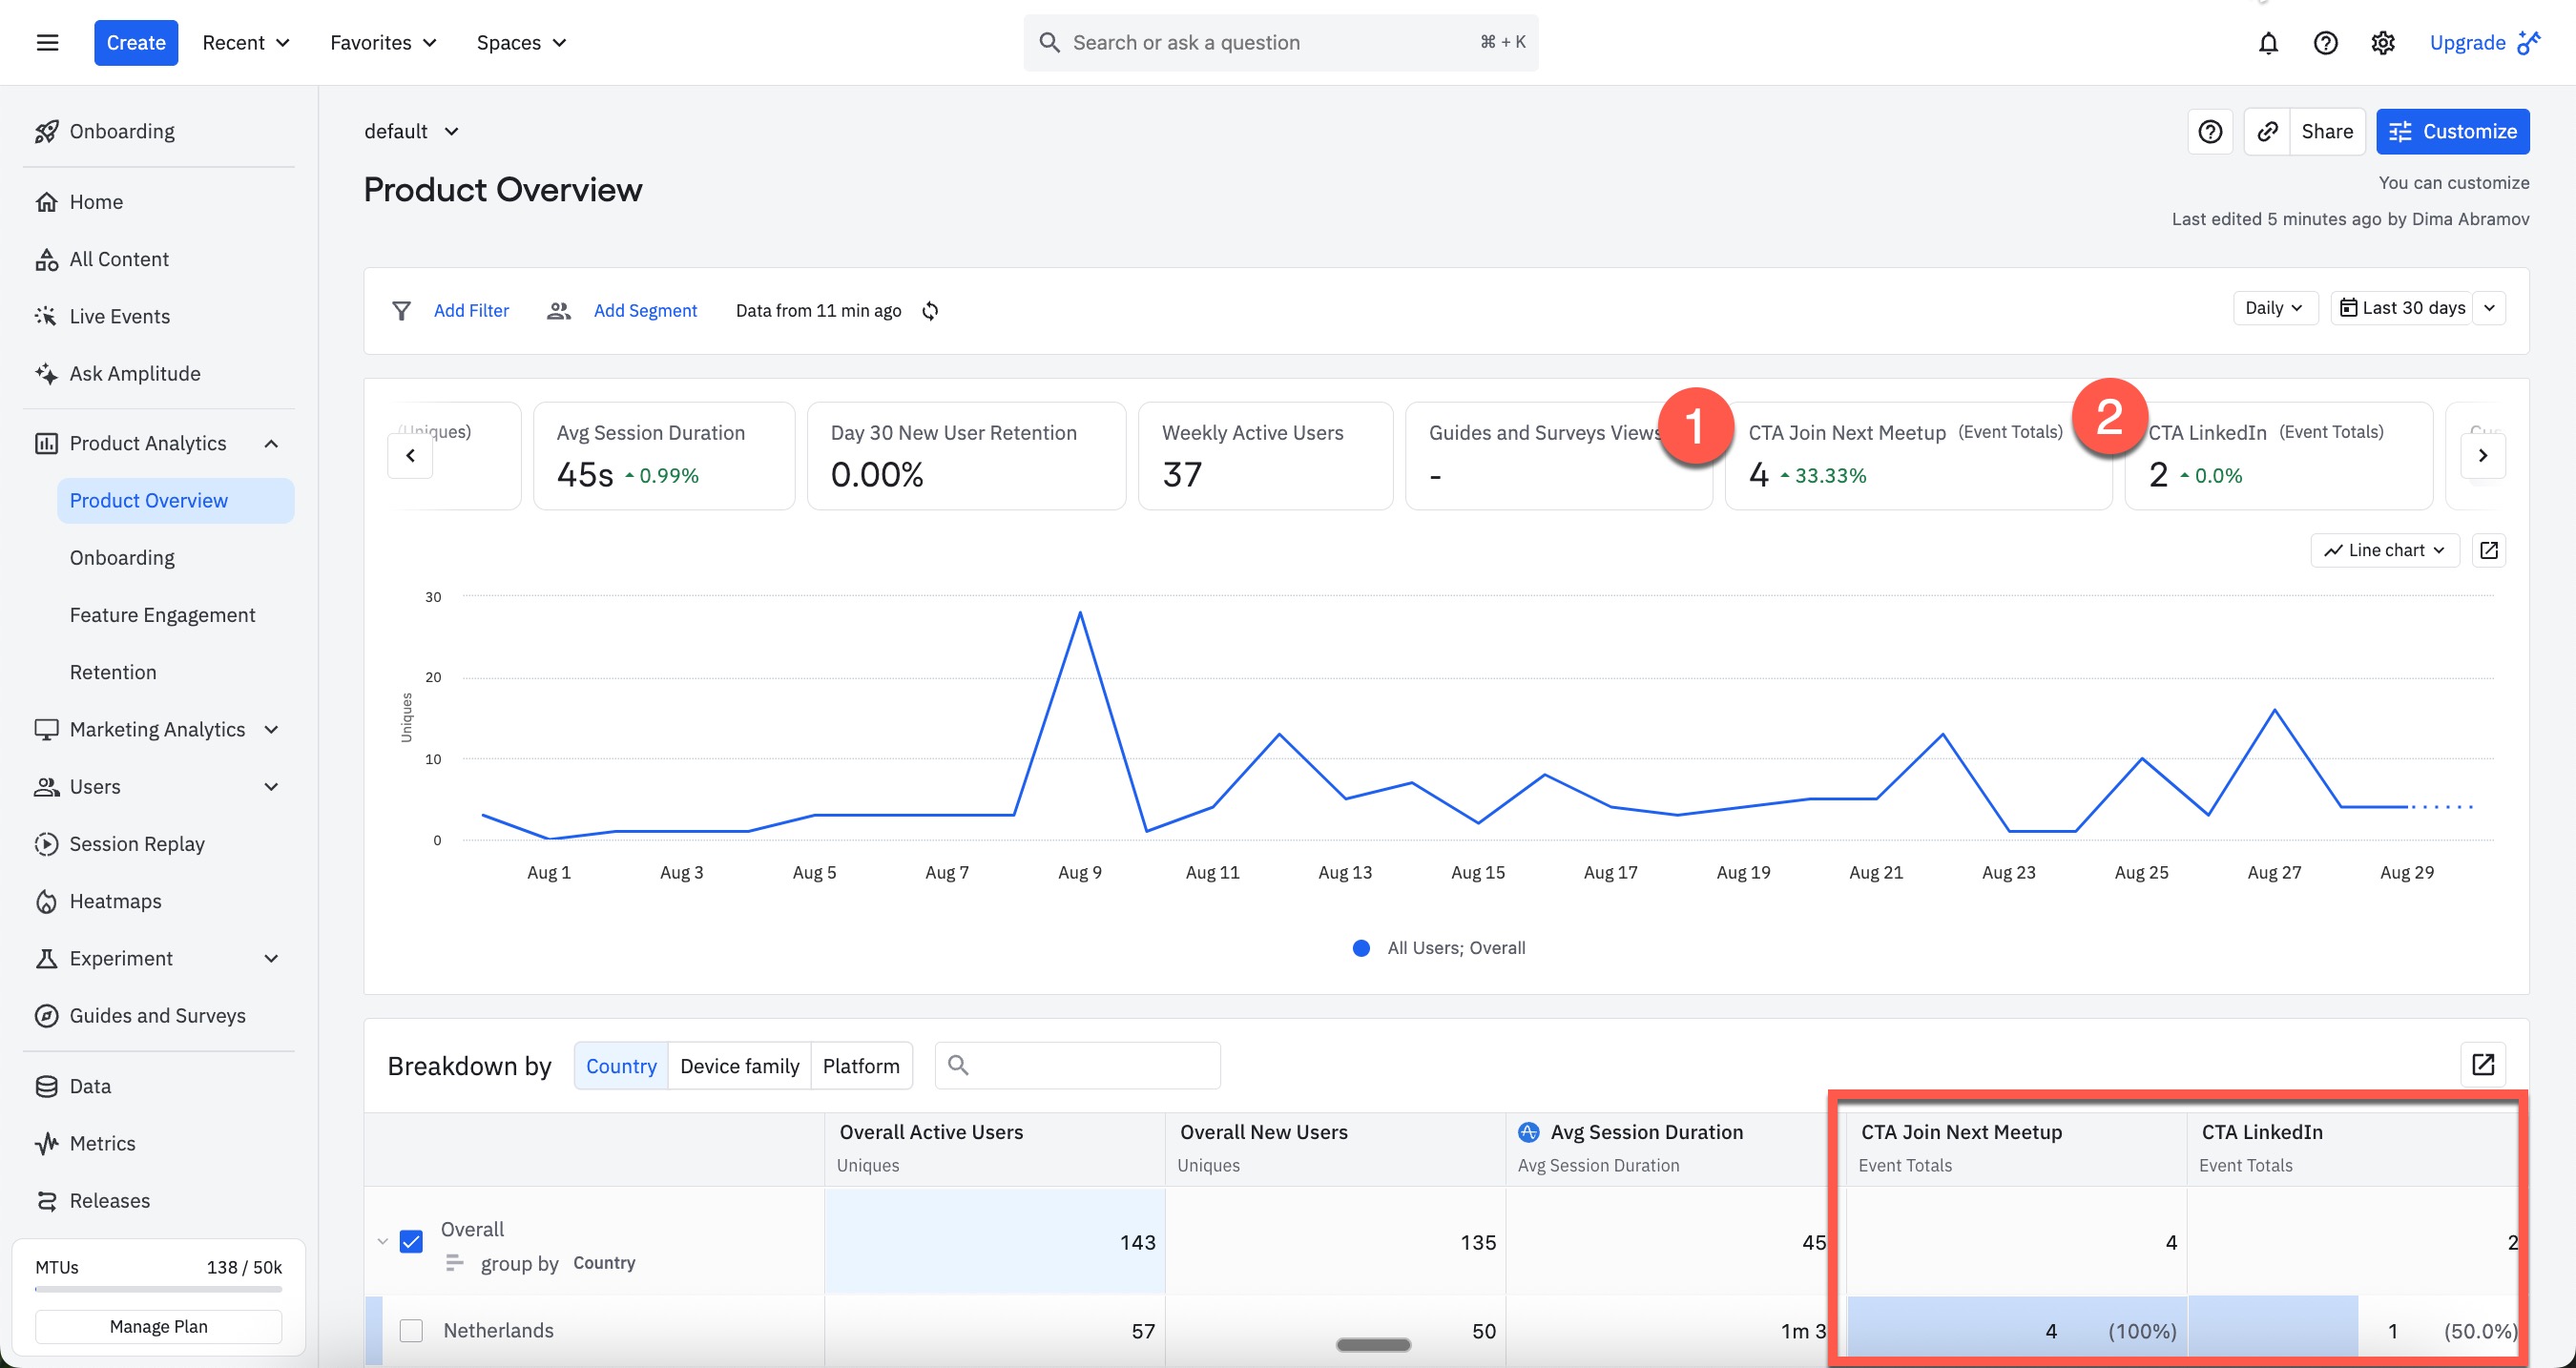
Defined custom events for key CTAs like "Join Next Meetup" and "LinkedIn Profile Click"
Enabled session replays using their built-in tools to watch how people navigate
What I Learned
With just a few tweaks, I was able to learn:
Which CTAs are actually getting clicks
Where users are coming from
How session duration varies across platforms and traffic sources
What content gets repeat visits
Who returns to the site — and why
One simple insight? After adding my main CTA to the homepage, I immediately saw an increase in clicks. Small changes, real feedback.
Why This Matters
I didn’t need a developer. I didn’t need complex dashboards. I just wanted to validate if my content was working. With Amplitude + Lovable, I can do that easily.
If you're building anything with Lovable and want real insights (beyond just vanity metrics), plug in Amplitude. It’s fast, free, and incredibly helpful.
Curious to see how it works in real life?
Come to the next Vibe Coding MeetUp. We'll talk about AI tools, rapid prototyping, and real experiments like this one.
Hope to see you there! 🚀